Visuals for Learning – Part 2: Compare and Contrast
The Art of Applied Visual Thinking
This week, we continue with the
Visuals for Learning series, where we learn to use visuals to simplify & codify complex info. Complex subject matter can be challenging for several reasons. The subject could be abstract or technical or require prolonged and intense study. There could be a large volume of material to be digested, or the method of presentation could be challenging to follow.
This week, we're looking at compare and contrast.
Comparing and contrasting is a standard analysis method in various academic, professional, and everyday contexts.

Use compare and contrast to highlight the similarities and differences between two or more items, concepts, ideas, or entities. Here are some situations where it is appropriate to use:
- Academic Essays
- Research Papers
- Decision-Making
- Product or Service Evaluation
- Business and Marketing
- Problem-Solving
- Personal Reflection
- Literature and Film Analysis
In any of these situations, visuals help quickly and easily organize the information. For compare and contrast, all you need is a simple chart, which we like to call a ZEE, such as a 2-Zee, 3-Zee, or 4-Zee.
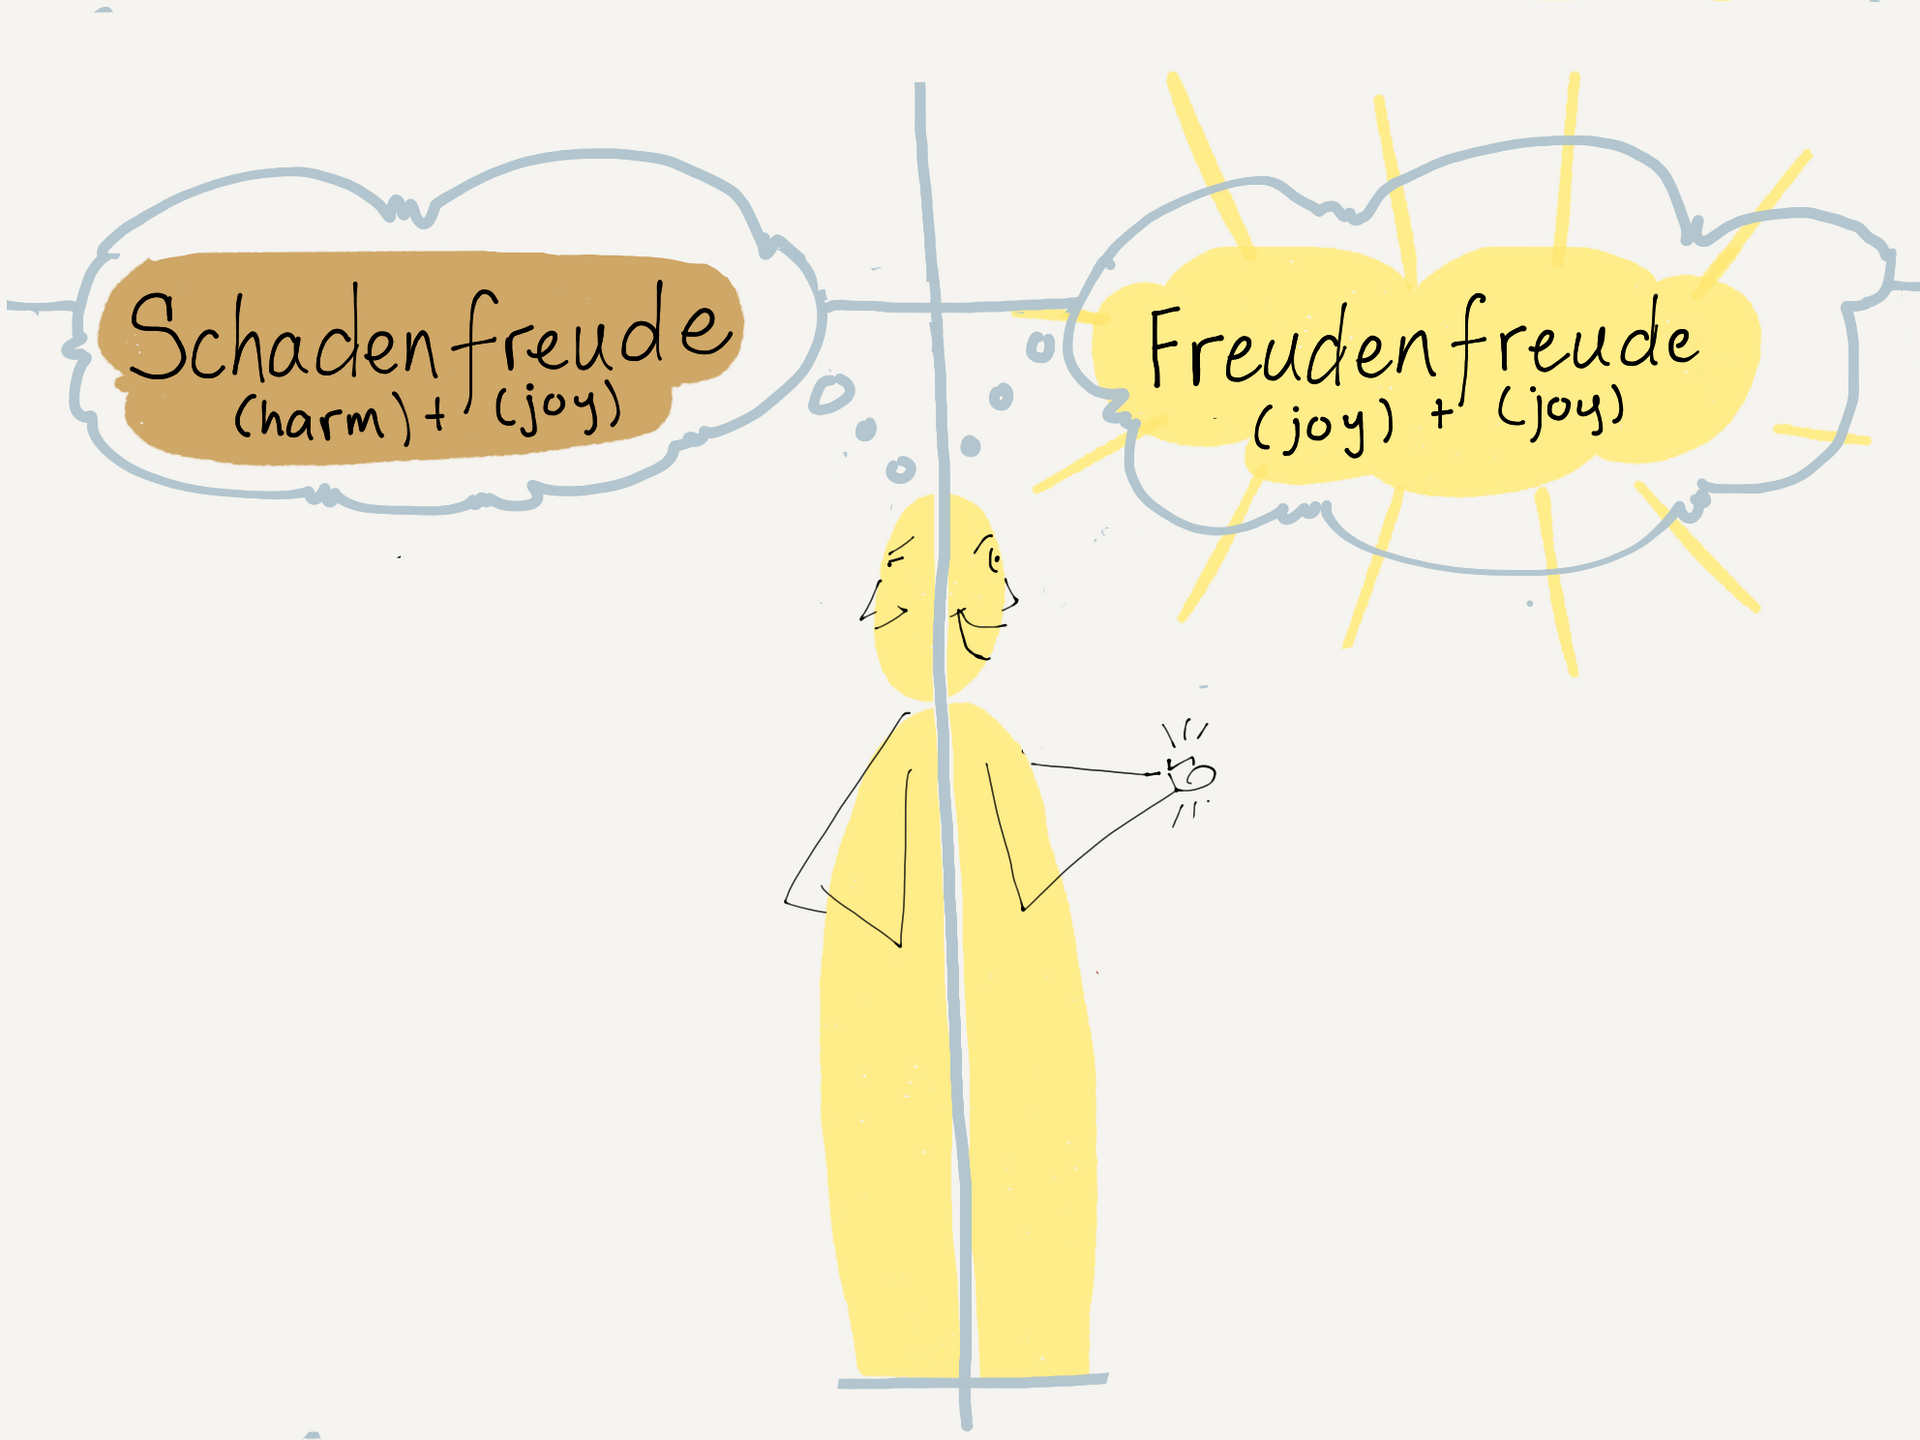
Recently, I have been reading Brené Brown's book, Atlas of the Heart. It's jam-packed with wonderful stories and essential information about creating a roadmap and language for understanding our emotions, vital information I wanted to learn and remember. I quickly noticed that many of the topics contrast with something else. To help me better understand and remember what I was learning, I began creating simple 2-ZEE diagrams of related emotions; below is one of my favorites.

Creating these diagrams helped me quickly grasp a deep and rich subject, while reviewing my drawings helped the information stick.
Learning something new?
Ready to jump in and give it a try? Grab something to write on and something to write with, and dive in.
Step 1: Determine how many subjects, items, or concepts you will compare.
Step 2: Create a template. A ZEE is a set of containers, one for each subject you want to compare and contrast. If you're comparing two items, two rectangles are all you need. If you have more items, add more containers. The containers can be any shape. Simple rectangles, circles, or hexagons are great places to start. If you want to be more creative, try drawing more complex shapes such as a clipboard, water glass, or a house.
Step 3: Review your material and quickly capture key concepts, essential facts, important dates, or ideas.
Step 4: Fill in your template. Using visual hierarchy, icons, colors and charts, maps, or diagrams, draw out how the items are alike and/or are different. Want to learn more about visual hierarchy? Check out our FOUNDATIONS course. When using the compare and contrast method, it's essential to provide clear criteria for comparison, whether you're comparing products, historical events, or concepts. Additionally, the structure of your comparison (e.g., block method or point-by-point method) and the purpose of your analysis will dictate how you organize your thoughts and present your findings.
Step 5: Store it. When creating visuals for learning, the key is to create useful information. Setting up a system to store and catalog your work is critical. This could take many forms, from a simple binder to a set of folders or a digital notebook. If you're working on paper but want to store your work digitally, you can use your smart device to take pictures and store them in your preferred app. One of my favorites is the Notes app for iPhone or iPad with smart folders based on keywords.
Step 6:
Use it. Schedule time to go back and review your drawings regularly. When learning new material,
repetition is the key to creating long-term memory and connections.
That's it. Learning is easier when you use visuals. Join us for the next newsletter in our
Visuals for Learning series, where we learn more about using visuals to simplify & codify complex info.


