Visuals for Learning – Part 1: How Do I Start?
The Art of Applied Visual Thinking
School is in session. Applying visuals to your learning jumpstarts the grey matter. This week we kick off the Visuals for Learning series. Learn how to simplify & codify complex info.
If you've found your way to AVT, you are most likely someone who enjoys learning new things.

You probably also know that learning complex subject matter can be challenging for several reasons. The subject itself could be abstract or technical, or require prolonged and intense study. There could be a large volume of material to be digested, or the method of presentation could be challenging to follow.
Despite these challenges, we at AVT know that when you are trying to learn and understand something complex, visuals help. But HOW exactly?
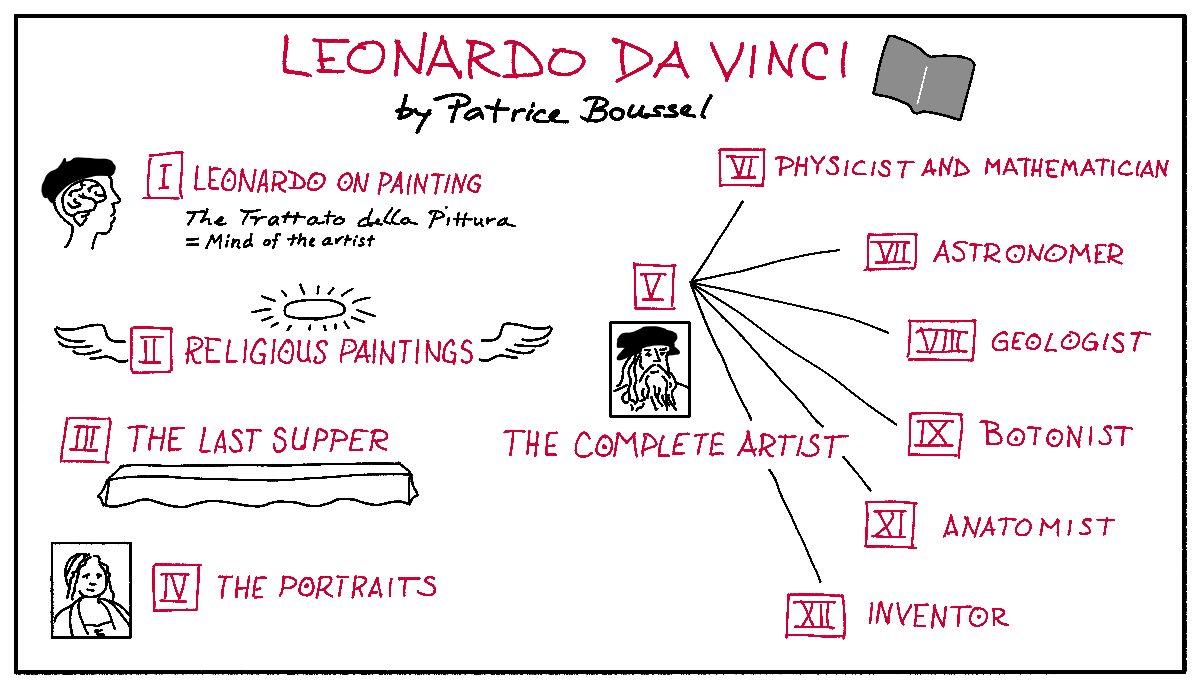
I recently picked up a book about Renaissance artist Leonardo da Vinci in search of some inspiration for a drawing course I'm designing. It was written in what I think of as traditional art history style – complex and technical, with a combination of facts and interpretation. There was no table of contents. I wanted a quick reference of the material so that I could locate the most relevant topics.
Here are two different summaries of the book. One uses simple shapes and color, the other icons. Both capture the overview of the contents.


We know it can be difficult to figure out which chart, map or diagram to use to best simplify and codify the information you are learning. In this Visuals for Learning series, we scan the landscape of visual diagrams and shed some light on which type of diagram will capture the type of information you are trying to learn.
Ready to put it into practice?
Ask yourself - what are you learning? Is it in a book or course or video? To get started, you'll need to gain an overview of the main topics. For example, if it's in a book, here's how you might begin.
Step 1: Gather the topics.
Scan the table of contents first, then the first and last paragraphs of the chapter. This should give you a sense of the flow of material and the major chunks you will encounter.
Step 2: Create a diagram or map that includes each chapter head.
The idea is to create a snapshot of the biggest chunks of material you are planning to learn so you can see them all on one page. Keep it simple and meaningful for yourself.
For example, a
simple mind map using a different color or simple shape around each chapter head is a great place to start. The purpose of visual thinking is to create visuals that are meaningful and useful.
Having this visual snapshot will be invaluable as a study aid later on.
If you need help creating your mind map, check out our My Visual Thinking Ace In The Hole blog post and download the attached template.
Great job. As you can imagine, these steps can be modified slightly and applied to learning through video or other formats.
That's it for this week. In upcoming newsletters in the Visuals for Learning series, we'll be taking a deeper dive into which kinds of charts, maps or diagrams are most useful when you are studying complex, technical or abstract information.
Be sure you're on our
email list. Come along on a deep dive into some of our favorite diagrams and when to use them in upcoming issues of The Art of Applied Visual Thinking.
References:
- Learning How to Learn: How to Succeed in School Without Spending All Your Time Studying; A Guide for Kids and Teens by Alistair McConville, Barbara Oakley PhD, Terrence Sejnowski PhD
- Leonardo da Vinci by Patrice Bousel, Konecky& Konecky


